信安内容实验3

image-20200505202005599

[TOC]

实验环境

IDE:pycharm

python版本:anacoda->python3.7

1、图像实验

1.1 背景介绍

本次实验,主要熟悉图像的python库操作,仿射变换的学习,以及图像的基本聚类分类方法。

(1)图像的基本知识

通常情况下,计算机中图像是一个三维数组,维度分别是高度、宽度和像素RGB值。

RGB色彩模式,即每个像素点的颜色由红(R)、绿(G)、蓝(B)组成,RGB三个颜色通道的变化和叠加得到各种颜色,其中每个通道值为0~255。

(2)库介绍

  • NumPy是一个开源的Python科学计算基础库。

    N维数组对象:ndarray

    • 数组对象可以去掉元素间运算所需的循环,使一维向量更像单个数据
    • 设置专门的数组对象,经过优化,可以提升这类应用的运算速度
  • PIL库(Python Image Library)Python中图像处理最常用的库

    PIL库是一个具有强大图像处理能力的第三方库。

    PILLOW官方文档:https://pillow.readthedocs.io/en/latest/reference/Image.html

    中文博客:http://blog.csdn.net/column/details/pythonpil.html?&page=1

  • OpenCV:是计算机视觉领域应用最广泛的开源工具包。

    基于C/C++,支持Linux/Windows/MacOS/Android/iOS,并提供了Python,Matlab和Java等语言的接口,因为其丰富的接口,优秀的性能和商业友好的使用许可,不管是学术界还是业界中都非常受欢迎。OpenCV旨在提供一个用于计算机视觉的科研和商业应用的高性能通用库。

    Anaconda命令行安装:

    1
    conda install --channel https://conda.anaconda.org/menpo opencv3

(3)图像的基本操作

图像的表示

1.将彩色RGB图片变为黑白(灰度)图片

灰度转换公式:L = R * 299/1000 + G * 587/1000+ B * 114/1000

PIL中,灰度表示模式为L模式,它的每个像素用8个bit表示,0表示黑,255表示白,其他数字表示不同的灰度。

1
2
3
4
5
from PIL import Image
im = Image.open('1.jpg')
im_l = im.convert("L")
im_1.show()
im_l.save('output1.jpg’)

image-20200504174904801

2.将彩色RGB图片变为“底片”模式

PIL中,当需要更个性化的图片时,可配合使用numpy,对图像中的数据进行操作将原图以灰度打开后,取反码(b=255-a)

1
2
3
4
5
6
from PIL import Image
import numpy as np
a = np.array(Image.open("1.jpg").convert('L'))
b = 255 - a
im = Image.fromarray(b.astype('uint8'))
im.save("output3.jpg")

image-20200504174823310

3.滤波器提取图片的信息

PIL的ImageFilter模块提供了滤波器相关定义,这些滤波器主要用于Image类的filter()方法。

例如,提取图片的轮廓信息:使用ImageFilter.CONTOU

1
2
3
4
5
6
from PIL import Image
from PIL import ImageFilter
a = Image.open('5.jpg')
b =
a.filter(ImageFilter.CONTOUR)
b.save("output5.jpg")

image-20200504174832839

4.图片读、写和显示操作

1
2
3
4
5
6
7
8
9
10
11
12
13
14
15
16
import numpy as np
import cv2 as cv
#读图片(有多种模式)
# Load an color image in grayscale
img = cv.imread(‘lena.jpg’,0) #显示图片
cv.imshow(‘image’,img) #第一个参数定义窗口名
cv.waitKey(0) #无限制的等待用户的按键
cv.destroyAllWindows()
#写
cv.imwrite(‘graylena.png',img)
import cv2 as cv
img = cv.imread('lena.jpg’)
#图片的相关属性
print(img.shape) #高度×宽度×通道数(灰度图只返回前两项)
print(img.size) #像素总数
print(img.dtype) #图像数据类型

结果:

1
2
3
(512, 512, 3)
786432
uint8

5.图像缩放

cv2.resize(src, dsize, dst, fx=0, fy=0, interpolation=INTER_LINEAR )

1.2 图像的仿射变换之图像缩放

仿射变换原理:

在仿射变换中,原始图像中的所有平行线仍将在输出图像中平行。
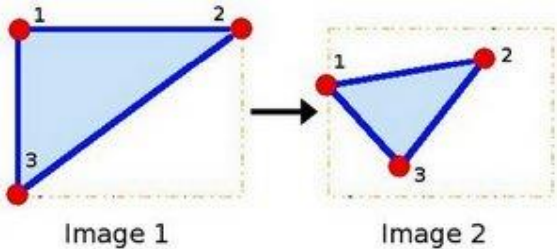
image-20200504175530141

为了找到变换矩阵,我们需要输入图像中的三个点及其在输出图像中的相应位置。

仿射变换矩阵:

一个任意的仿射变换都能表示为 乘以一个矩阵 (线性变换) 接着再 加上一个向量 (平移).

  • 旋转 (线性变换) 、平移 (向量加) 、缩放操作 (线性变换)

我们通常使用 2 x 3 矩阵来表示仿射变换.其中左边的2×2子矩阵是线性变换矩阵,右边的2×1的

两项是平移项:

image-20200504175115434

image-20200504175134255

宽度方向是x,高度方向是y,坐标的顺序和图像像素对应下标一致。

所以原点的位置不是左下角而是左上角,y的方向也不是向上,而是向下。

对于图像上的任一位置(x,y),仿射变换执行的是如下的操作:

image-20200504175150544

使用cv.getAffineTransform()将创建一个2x3矩阵,将该矩阵传递给cv.warpAffine()得到结果。

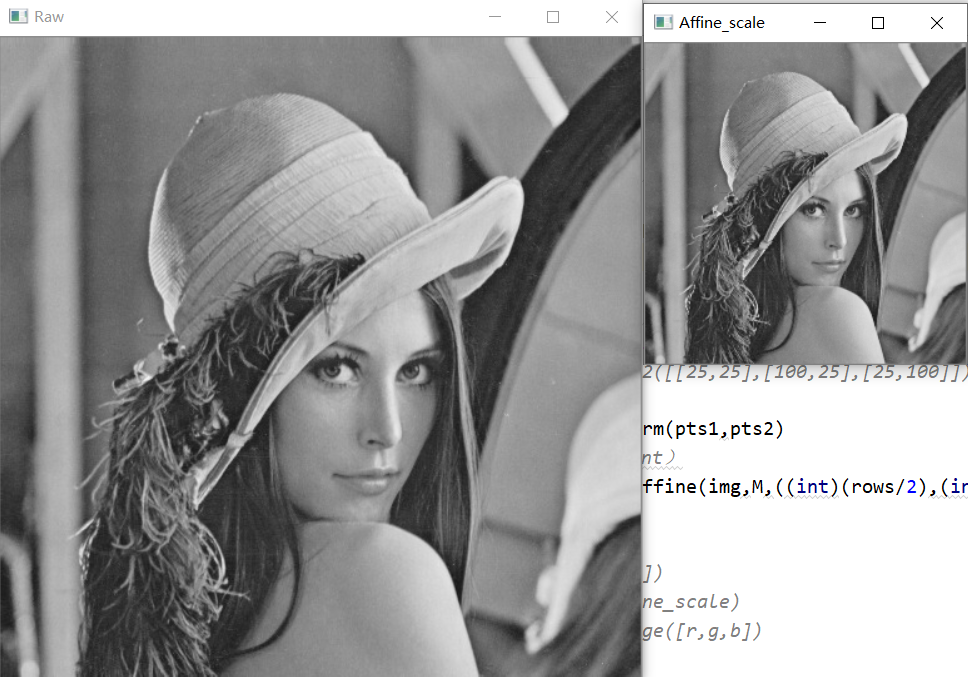
仿射变换进行图像缩放,代码如下

1
2
3
4
5
6
7
8
9
10
11
12
13
14
15
16
17
# -*- coding: UTF-8 -*-
import numpy as np
import cv2 as cv
#加载图片
img = cv.imread('lena.jpg',0)
rows,cols = img.shape

#根据三点的横纵坐标均缩小一倍计算仿射变换
pts1 = np.float32([[50,50],[200,50],[50,200]])
pts2=pts1/2 # np.float32([[25,25],[100,25],[25,100]])
#获得仿射变换矩阵
M = cv.getAffineTransform(pts1,pts2)
#warpAffine长宽的一半(int)
Affine_scale = cv.warpAffine(img,M,((int)(rows/2),(int)(cols/2)))
cv.imshow('Raw',img)
cv.imshow('Affine_scale',Affine_scale)
cv.waitKey(0)

结果如下:

image-20200504173747162

1.3 图像的透视变换(空间变换)

对于透视变换,需要一个3x3变换矩阵。在转换之后,直线仍将保持笔直。

要找到此变换矩阵,输入图像上需要4个点,输出图像上需要相应的。在这4个点中,其中3个不应该共线。

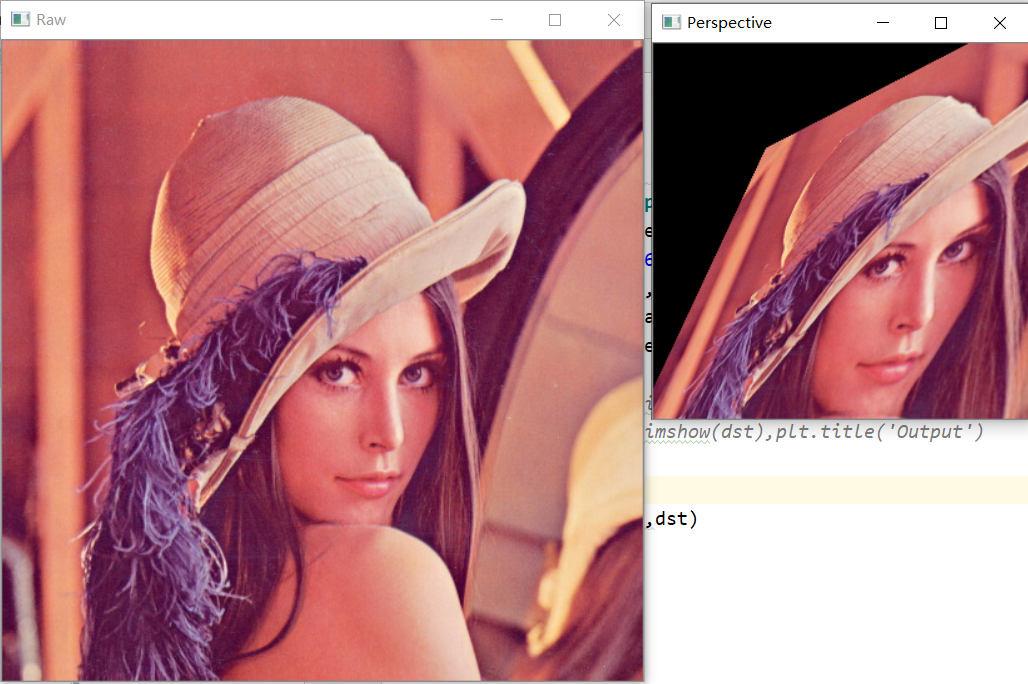
通过函数cv2.getPerspectiveTransform找到变换矩阵,将该矩阵传递给cv2.warpPerspective得到结果。

Tips
仿射变换和透视变换更直观的叫法可以叫做“平面变换”和“空间变换”或者“二维坐标变换”和“三维坐标变换”。
从另一个角度也能说明三维变换和二维变换的意思,仿射变换的方程组有6个未知数,所以要求解就需要找到3组映射点,三个点刚好确定一个平面。透视变换的方程组有8个未知数,所以要求解就需要找到4组映射点,四个点就刚好确定了一个三维空间。

参考资料:

opencv python 图像缩放/图像平移/图像旋转/仿射变换/透视变换

代码

1
2
3
4
5
6
7
8
9
10
11
12
13
14
15
16
17
import cv2
import numpy as np
import matplotlib.pylab as plt

img = cv2.imread('img6.jpg')
rows,cols,ch = img.shape

pts1 = np.float32([[56,65],[368,52],[28,387],[389,390]])
pts2 = np.float32([[0,0],[300,0],[0,300],[300,300]])

M = cv2.getPerspectiveTransform(pts1,pts2)

dst = cv2.warpPerspective(img,M,(300,300))

plt.subplot(121),plt.imshow(img),plt.title('Input')
plt.subplot(122),plt.imshow(dst),plt.title('Output')
plt.show()

结果如下:

image-20200504173711245

1.4 通过HOG特征来分类——OCR

OCR:

(Optical Character Recognition,光学字符识别)是指电子设备(例如扫描仪或数码相机)检查纸上打印的字符,通过检测暗、亮的模式确定其形状,然后用字符识别方法将形状翻译成计算机文字的过程;即,对文本资料进行扫描,然后对图像文件进行分析处理,获取文字及版面信息的过程。

一般流程如下:

图像文件输入 → 图像特征提取 → 分类器训练 → 预测 → 识别结果输出→ 计算正确率 → …

HOG方向梯度直方图:

(Histogram of Oriented Gradient, HOG)特征是一种在计算机视觉和图像处理中用来进行物体检测的特征描述子。它通过计算和统计图像局部区域的梯度方向直方图来构成特征。HOG特征结合SVM分类器已经被广泛应用于图像识别中,尤其在行人检测中获得了极大的成功。

HOG步骤如下:

1
2
3
4
5
6
HOG特征提取方法就是将一个image(你要检测的目标或者扫描窗口):
1)灰度化(将图像看做一个x,y,z(灰度)的三维图像);
2)采用Gamma校正法对输入图像进行颜色空间的标准化(归一化);目的是调节图像的对比度,降低图像局部的阴影和光照变化所造成的影响,同时可以抑制噪音的干扰;
3)计算图像每个像素的梯度(包括大小和方向);主要是为了捕获轮廓信息,同时进一步弱化光照的干扰。
4)将图像划分成小cells(例如10*10像素/cell);
5)统计每个cell的梯度直方图(不同梯度的个数),即可形成每个cell的descriptor; 6)将每几个cell组成一个block(例如2*2个cell/block),一个block内所有cell的特征descriptor串联起来便得到该block的HOG特征descriptor。 7)将图像image内的所有block的HOG特征descriptor串联起来就可以得到该image(你要检测的目标)的HOG特征descriptor了。这个就是最终的可供分类使用的特征向量了。

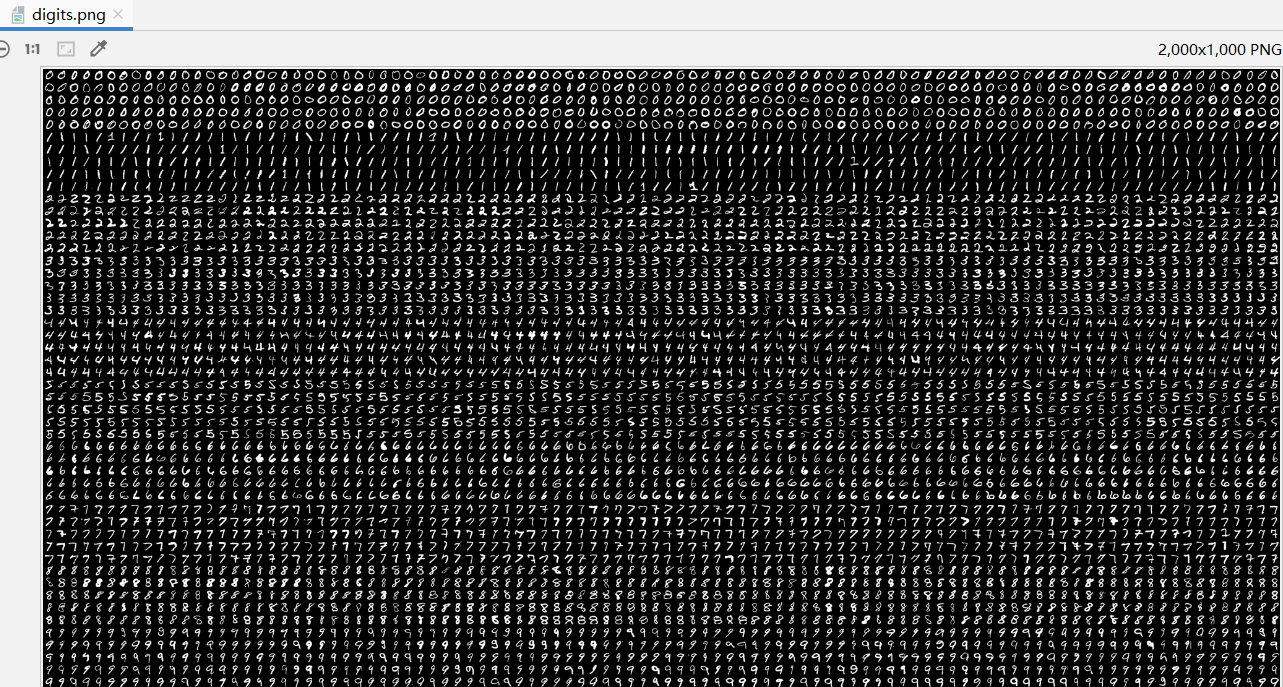
这次实验用的是一张图的数据集(digits.png)来训练:

image-20200504180152299

原代码如下:

1
2
3
4
5
6
7
8
9
10
11
12
13
14
15
16
17
18
19
20
21
22
23
24
25
26
27
28
29
30
31
32
33
34
35
36
37
38
39
40
41
42
43
44
45
46
47
48
49
50
51
52
53
54
55
56
57
58
59
60
61
62
63
64
65
66
67
68
69
70
71
72
73
74
75
76
77
78
79
80
81
82
83
84
85
86
87
88
89
90
91
92
93
94
95
96
97
98
99
100
101
102
103
104
105
106
107
108
109
110
111
112
113
114
115
116
117
118
119
120
121
122
123
124
125
126
127
128
129
130
131
132
133
134
135
136
137
138
139
140
141
142
143
144
145
146
147
148
149
150
151
152
153
154
155
156
157
158
159
160
161
162
163
164
165
166
167
168
169
170
171
172
173
174
175
176
177
178
179
180
181
182
183
184
185
#!/usr/bin/env python

'''
SVM and KNearest digit recognition.

Sample loads a dataset of handwritten digits from '../data/digits.png'.
Then it trains a SVM and KNearest classifiers on it and evaluates
their accuracy.

Following preprocessing is applied to the dataset:
- Moment-based image deskew (see deskew())
- Digit images are split into 4 10x10 cells and 16-bin
histogram of oriented gradients is computed for each
cell
- Transform histograms to space with Hellinger metric (see [1] (RootSIFT))


[1] R. Arandjelovic, A. Zisserman
"Three things everyone should know to improve object retrieval"
http://www.robots.ox.ac.uk/~vgg/publications/2012/Arandjelovic12/arandjelovic12.pdf

Usage:
digits.py
'''


# Python 2/3 compatibility
from __future__ import print_function

# built-in modules
from multiprocessing.pool import ThreadPool

import cv2 as cv

import numpy as np
from numpy.linalg import norm

# local modules
from common import clock, mosaic


SZ = 20 # size of each digit is SZ x SZ
CLASS_N = 10
DIGITS_FN = '../data/digits.png'
#分割并且每张图缩放为20*20
def split2d(img, cell_size, flatten=True):
h, w = img.shape[:2]
sx, sy = cell_size
cells = [np.hsplit(row, w//sx) for row in np.vsplit(img, h//sy)]
cells = np.array(cells)
if flatten:
cells = cells.reshape(-1, sy, sx)
return cells
#加载digits数据集
def load_digits(fn):
print('loading "%s" ...' % fn)
digits_img = cv.imread(fn, 0)
digits = split2d(digits_img, (SZ, SZ))
labels = np.repeat(np.arange(CLASS_N), len(digits)/CLASS_N)
return digits, labels
#纠正图片倾斜
def deskew(img):
m = cv.moments(img)
if abs(m['mu02']) < 1e-2:
return img.copy()
skew = m['mu11']/m['mu02']
M = np.float32([[1, skew, -0.5*SZ*skew], [0, 1, 0]])
img = cv.warpAffine(img, M, (SZ, SZ), flags=cv.WARP_INVERSE_MAP | cv.INTER_LINEAR)
return img
#模型的加载和保存
class StatModel(object):
def load(self, fn):
self.model.load(fn) # Known bug: https://github.com/opencv/opencv/issues/4969
def save(self, fn):
self.model.save(fn)
#knn分类器
class KNearest(StatModel):
def __init__(self, k = 3):
self.k = k
self.model = cv.ml.KNearest_create()
#训练
def train(self, samples, responses):
self.model.train(samples, cv.ml.ROW_SAMPLE, responses)
#评估
def predict(self, samples):
_retval, results, _neigh_resp, _dists = self.model.findNearest(samples, self.k)
return results.ravel()
#SVM分类器训练
class SVM(StatModel):
def __init__(self, C = 1, gamma = 0.5):
self.model = cv.ml.SVM_create()
self.model.setGamma(gamma)
self.model.setC(C)
self.model.setKernel(cv.ml.SVM_RBF)
self.model.setType(cv.ml.SVM_C_SVC)
#训练
def train(self, samples, responses):
self.model.train(samples, cv.ml.ROW_SAMPLE, responses)
#评估
def predict(self, samples):
return self.model.predict(samples)[1].ravel()

#测试集评估模型
def evaluate_model(model, digits, samples, labels):
resp = model.predict(samples)
err = (labels != resp).mean()
print('error: %.2f %%' % (err*100))

confusion = np.zeros((10, 10), np.int32)
for i, j in zip(labels, resp):
confusion[i, int(j)] += 1
print('confusion matrix:')
print(confusion)
print()

vis = []
for img, flag in zip(digits, resp == labels):
img = cv.cvtColor(img, cv.COLOR_GRAY2BGR)
if not flag:
img[...,:2] = 0
vis.append(img)
return mosaic(25, vis)
#简单预处理
def preprocess_simple(digits):
return np.float32(digits).reshape(-1, SZ*SZ) / 255.0
#hog特征计算
def preprocess_hog(digits):
samples = []
for img in digits:
gx = cv.Sobel(img, cv.CV_32F, 1, 0) #sobel算子边缘检测 一阶差分滤波器
gy = cv.Sobel(img, cv.CV_32F, 0, 1)
mag, ang = cv.cartToPolar(gx, gy) #极坐标变换 (模 角度)
bin_n = 16 #区间数
bin = np.int32(bin_n*ang/(2*np.pi))
bin_cells = bin[:10,:10], bin[10:,:10], bin[:10,10:], bin[10:,10:]
mag_cells = mag[:10,:10], mag[10:,:10], mag[:10,10:], mag[10:,10:]
hists = [np.bincount(b.ravel(), m.ravel(), bin_n) for b, m in zip(bin_cells, mag_cells)] #统计梯度直方图
hist = np.hstack(hists)
# transform to Hellinger kernel to quantify the similarity of two probability distributions
eps = 1e-7
hist /= hist.sum() + eps
hist = np.sqrt(hist)
hist /= norm(hist) + eps

samples.append(hist)
return np.float32(samples)


if __name__ == '__main__':
print(__doc__)

digits, labels = load_digits(DIGITS_FN) #图像切分 导入

print('preprocessing...')
# shuffle digits
rand = np.random.RandomState(321) #随机种子321
shuffle = rand.permutation(len(digits))
digits, labels = digits[shuffle], labels[shuffle] #打乱数字顺序

digits2 = list(map(deskew, digits)) #纠正图片倾斜
samples = preprocess_hog(digits2) #计算hog特征

train_n = int(0.9*len(samples)) #划分训练测试集
print(train_n)
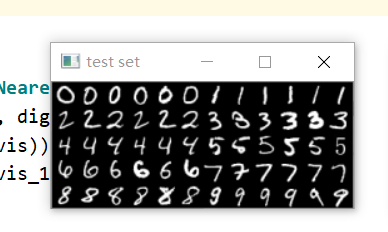
cv.imshow('test set', mosaic(25, digits[train_n:]))#展示划分出来的测试数据集
digits_train, digits_test = np.split(digits2, [train_n])#图像数据
samples_train, samples_test = np.split(samples, [train_n])#特征数据
labels_train, labels_test = np.split(labels, [train_n])#标签分割

print('training KNearest...') #knn分类器
model = KNearest(k=4)
model.train(samples_train, labels_train)
vis = evaluate_model(model, digits_test, samples_test, labels_test)
cv.imshow('KNearest test', vis)

print('training SVM...') #SVM分类器
model = SVM(C=2.67, gamma=5.383)
model.train(samples_train, labels_train)
vis = evaluate_model(model, digits_test, samples_test, labels_test)
cv.imshow('SVM test', vis)
print('saving SVM as "digits_svm.dat"...')
model.save('digits_svm.dat')

cv.waitKey(0)

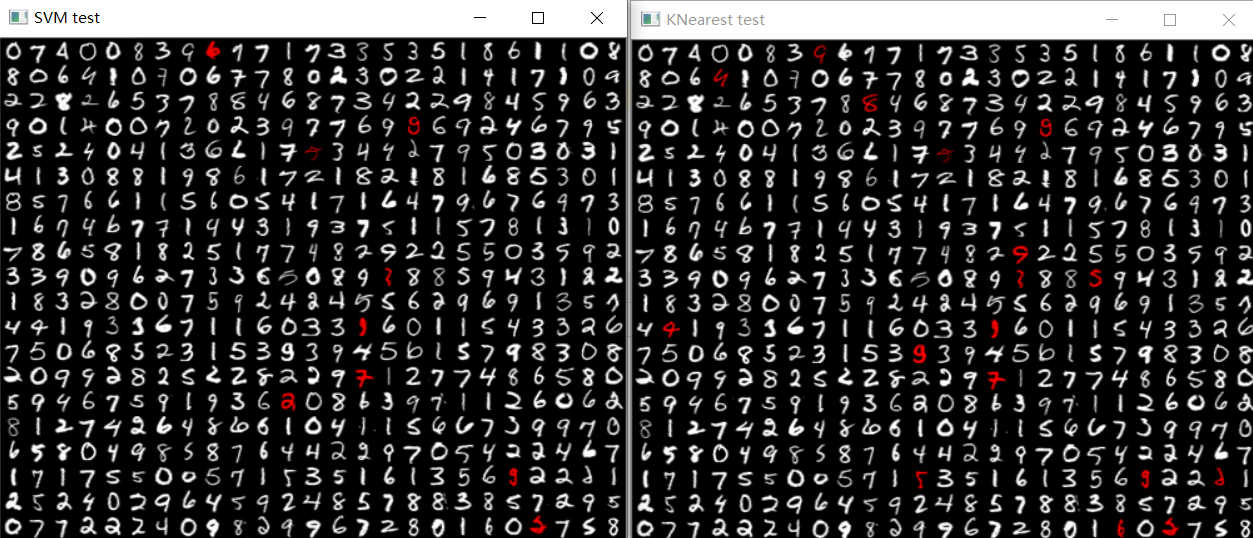
训练结果如下:

其中,白色的数字为分类识别成功,红色的为识别错误

image-20200504181130518

1.5 HOG特征,自找数据集进行测试

这里我选择了mnist的图、以及word做的一些图混合来进行测试:

mnist的图像大小都是28 * 28,word做的也不是20*20,我们用仿射变换来进行缩小为 20 * 20

数据集,每一种数字有6个,总共有6 * 10=60张图:
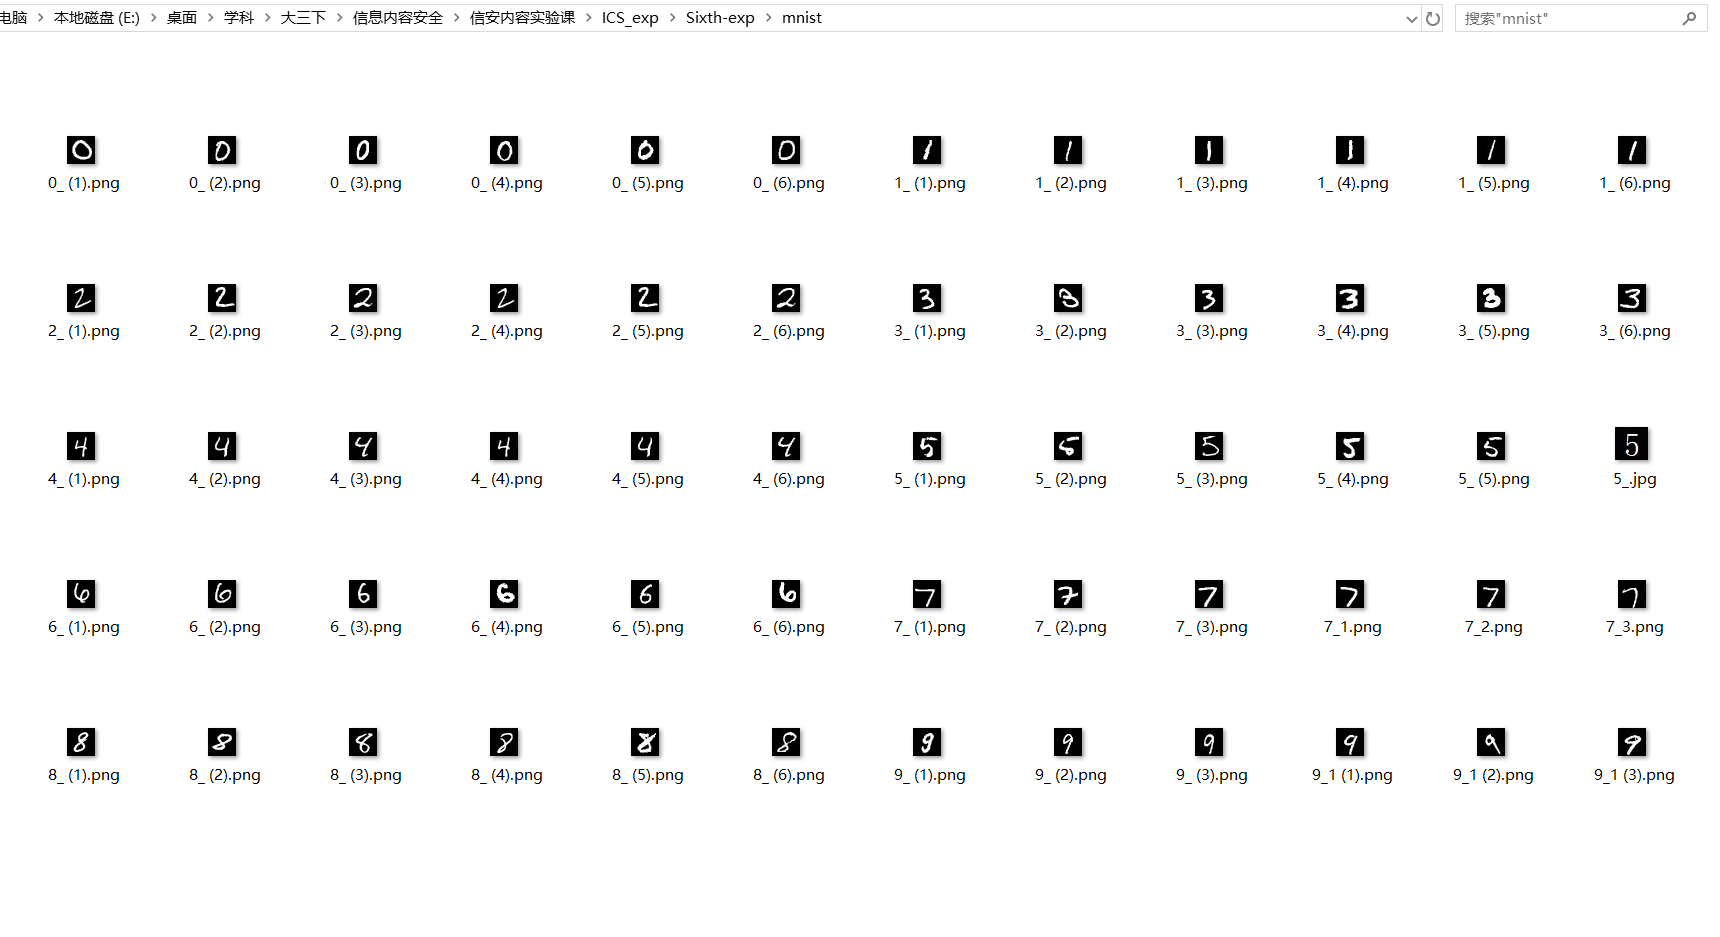
image-20200504192849951

image-20200504191505663

其中有个复杂的点,数据结构的问题:

1
2
3
# resp = model.predict(samples)
#这里加个[1].flatten()是因为读出的模型predict的datatype要转化为nparray
resp=model.predict(samples)[1].flatten()

代码:

1
2
3
4
5
6
7
8
9
10
11
12
13
14
15
16
17
18
19
20
21
22
23
24
25
26
27
28
29
30
31
32
33
34
35
36
37
38
39
40
41
42
43
44
45
46
47
48
49
50
51
52
53
54
55
56
57
58
59
60
61
62
63
64
65
66
67
68
69
70
71
72
73
74
75
76
77
78
79
80
81
82
83
84
85
86
87
88
89
90
91
92
93
94
95
96
97
98
99
100
101
102
103
104
105
106
107
108
109
110
111
112
113
114
import cv2 as cv
import numpy as np
from numpy.linalg import norm
from common import clock, mosaic
import os


SZ = 20 # size of each digit is SZ x SZ

# 纠正图像倾斜
def deskew(img):
m = cv.moments(img)
if abs(m['mu02']) < 1e-2:
return img.copy()
skew = m['mu11']/m['mu02']
M = np.float32([[1, skew, -0.5*SZ*skew], [0, 1, 0]])
img = cv.warpAffine(img, M, (SZ, SZ), flags=cv.WARP_INVERSE_MAP | cv.INTER_LINEAR)
return img

#hog特征计算
def preprocess_hog(digits):
samples = []
for img in digits:
gx = cv.Sobel(img, cv.CV_32F, 1, 0) #sobel算子 边缘检测 一阶差分滤波器
gy = cv.Sobel(img, cv.CV_32F, 0, 1)
mag, ang = cv.cartToPolar(gx, gy) #极坐标变换 (模 角度)
bin_n = 16 #区间数
bin = np.int32(bin_n*ang/(2*np.pi))
bin_cells = bin[:10,:10], bin[10:,:10], bin[:10,10:], bin[10:,10:]
mag_cells = mag[:10,:10], mag[10:,:10], mag[:10,10:], mag[10:,10:]
hists = [np.bincount(b.ravel(), m.ravel(), bin_n) for b, m in zip(bin_cells, mag_cells)] #统计梯度直方图
hist = np.hstack(hists)
# transform to Hellinger kernel to quantify the similarity of two probability distributions
eps = 1e-7
hist /= hist.sum() + eps
hist = np.sqrt(hist)
hist /= norm(hist) + eps

samples.append(hist)
return np.float32(samples)


#评估函数,基本没改
def evaluate_model_2(model, digits, samples, labels):
# resp = model.predict(samples)
#这里加个[1].flatten()是因为读出的模型predict的datatype要转化为nparray
resp=model.predict(samples)[1].flatten()
print(labels)
print(resp)
err = (labels != resp).mean()
print('error: %.2f %%' % (err*100))

confusion = np.zeros((10, 10), np.int32)
for i, j in zip(labels, resp):
confusion[i, int(j)] += 1
print('confusion matrix:')
print(confusion)
print()

vis = []
for img, flag in zip(digits, resp == labels):
img = cv.cvtColor(img, cv.COLOR_GRAY2BGR) #RGB显示?
if not flag:
img[...,:2] = 0 #变红
vis.append(img)
# 以25为一行
return vis

#读取mnist测试数据集
def read_mnist():
path = "mnist" # 文件夹目录
files = os.listdir(path) # 得到文件夹下的所有文件名称
s = "" #全部文件名字符串
digits_img=[] #图片数组
for file in files: # 遍历文件夹
if not os.path.isdir(file): # 判断是否是文件夹,不是文件夹才打开
s=s+file
print('loading "%s" ...' % file)#加载某个文件
img = cv.imread("mnist//"+file, 0)#读取图片
#resize为20*20
img = cv.resize(img, (20, 20), interpolation=cv.INTER_AREA)
digits_img.append(img)
# 改为np数组
digits_img = np.array(digits_img)
# lable数组
labels = np.repeat(np.arange(10), len(digits_img) / 10)
print(s) # 打印读取的文件名
return digits_img,labels

#测试mnist数据集
def test_mnist():
#加载数据集
digits_img,labels=read_mnist()
# 纠正图片倾斜
digits2 = list(map(deskew, digits_img))
# 计算hog特征
samples = preprocess_hog(digits2)
#展示test数据集
cv.imshow('test set', mosaic(16, digits_img))

#SVM模型分类
model=cv.ml.SVM_load('SVM.dat')
vis = evaluate_model_2(model, digits2, samples, labels)
cv.imshow('SVM test', mosaic(16, vis))

#KNN模型分类
model=cv.ml.KNearest_load('KNearest.dat')
vis = evaluate_model_2(model, digits2, samples, labels)
cv.imshow('KNN test', mosaic(16, vis))

cv.waitKey(0)

if __name__ == '__main__':
test_mnist()

结果:

可以看到,OCR效果还是不错的

image-20200504191549805

2、音频实验

2.1 背景介绍

本节实验课,实践音频的相关操作和库,以及一些基本特征的提取。

使用了实验自带的音频

第一个实验(读取音频信息)用到的库:

音频库:wave 库 https://docs.python.org/3/library/wave.html

绘图库:pylab库,这是 Matplotlib 和Ipython提供的一个模块,提供了类似Matlab的语法

Matplotlib是一个Python的图形框架,类似于MATLAB,同时还可以使用内嵌的latex引擎绘制的数学公式。

LibROSA是python用于音乐、音频分析的一个工具包。官方文档:http://librosa.github.io/librosa/

第二个实验(读取音频特征)用到的库:

安装LibROSA :

windows命令行下pip install librosa

或anaconda命令行下conda install -c conda-forge librosa

LibROSA需要ffmpeg支持(用于音频和视频多种格式的录影、转换、流功能)

安装ffmpeg:

ffmpeg下载https://www.ffmpeg.org/download.html

配置环境向量http://alleni123.iteye.com/blog/2028433

2.2 使用wave读取音频文件的信息

  • 采样率
    外界的声音都是模拟信号,在数字设备中A/D转化成为了由0、1表示的数字信号后被储存下来。数字信号都是离散的,所以采样率是指一秒钟采样的次数,采样率越高,还原的声音也就越真实。由于人耳听觉范围是20Hz~20kHz,根据香农采样定理(也叫奈奎斯特采样定理),理论上来说采样率大于40kHz的音频格式都可以称之为无损格式
  • *位深度 *
    若要尽可能精确地还原声音,只有高采样率是不够的。描述一个采样点,横轴(时间)代表采样率,纵轴(幅度)代表位深度。
  • 码率
    在无损无压缩格式中(如.wav),码率=采样率x位深度x声道数。在有损压缩中(如.mp3)码率便不等于这个公式了,因为原始信息已经被破坏。
  • 奈奎斯特采样定律:在进行模拟/数字信号的转换过程中,当采样频率fs.max大于信号中最高频率fmax的2倍时(fs.max>2fmax),采样之后的数字信号完整地保留了原始信号中的信息。
  • 人耳听音频率范围: 20Hz~20kHz标准格式化的WAV文件和CD格式一样,采样频率为44.1K。
  • 无损编码: 能够由编码后的数据完全无误地恢复原始信号采样值。常见的无损编码格式:APE、FLAC。
  • 有损编码: 根据人耳对不同频率的声音感知敏感度不同,在压缩过程中损失一部分音质以换取更高的压缩比,由于编码过程中有信息的损失,无法完全恢复原始信号。

代码如下,说明已在代码中详细注释标出:

1
2
3
4
5
6
7
8
9
10
11
12
13
14
15
16
17
18
19
20
21
22
23
24
25
26
27
28
29
30
31
32
33
34
35
36
37
38
# -*- coding: UTF-8 -*-
import wave
import pylab as pl
import numpy as np
f = wave.open(r"1.wav","rb")
# 读取格式信息
params = f.getparams()

# 读取wav文件信息(依次为声道数、位深度、采样频率、采样点数)
nchannels, sampwidth, framerate, nframes = params[:4]

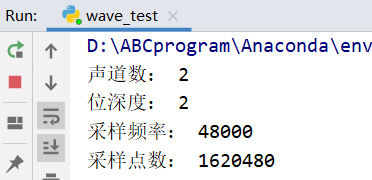
print("声道数:",nchannels)
print("位深度:",sampwidth)
print("采样频率:",framerate)
print("采样点数:",nframes)

# 读取波形数据
str_data = f.readframes(nframes)
f.close()
#将波形数据转换为数组
wave_data = np.fromstring(str_data, dtype=np.short)
#该文件为双声道,数组列数为2
wave_data.shape = -1, 2
wave_data = wave_data.T
#时长为总点数/频率
time = np.arange(0, nframes) * (1.0 / framerate)

# 绘制波形
pl.subplot(211)
#声道1(左声道),蓝色
pl.plot(time, wave_data[0])

pl.subplot(212)
#声道2(右声道),绿色
pl.plot(time, wave_data[1], c="g")
#横轴为时间、纵轴为幅度的量化值
pl.xlabel("time (seconds)")
pl.show()

音频基本信息如下所示:

image-20200504152416006

音频波形图:

蓝色部分为声道1(左声道),绿色部分为声道2(右声道)横轴为时间、纵轴为幅度的量化值:
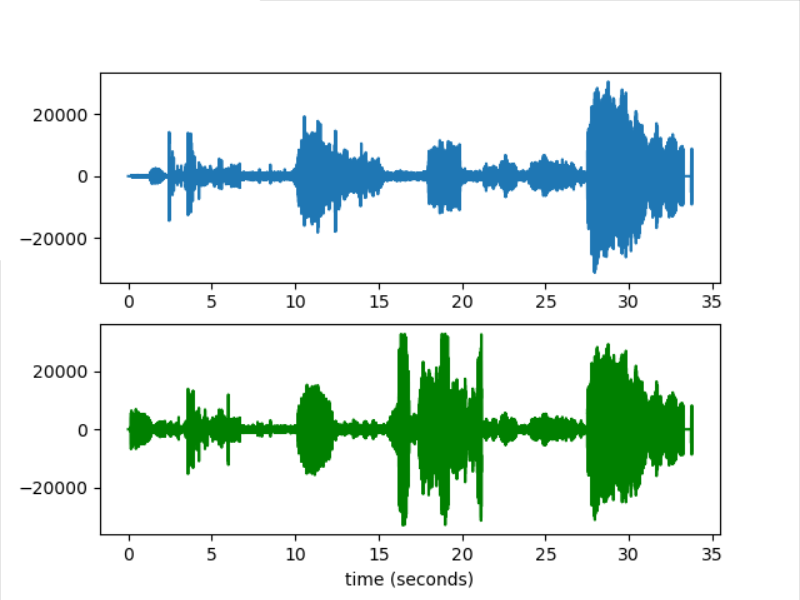
image-20200504152437022

2.3 使用LibROSA分别计算音频的MFCC和Chroma特征

每个音频信号都包含许多特征。但是,我们必须提取与我们试图解决的问题相关的特征。提取要使用它们进行分析的特征的过程称为特征提取,让我们详细研究一些特征。

音频特征基础:

谐波、冲击源分离(Harmonic Percussive Source Separation, HPSS)

一般而言,音乐信号在频谱图通常呈面两种形式分布,一种是沿时间轴连续平滑分布,另一种是沿频率轴连续平滑分布,通常将这两种分布的音源分别称作谐波源冲击源。乐器可大致分为管弦乐器和打击乐器。管弦乐器产生的音源一般舒缓,音与音之间连续衔接,且频谱图上表现为平滑的包络,常见的管弦乐器有笛子、筝、小提琴、钢琴(钢琴虽不是严格意义上的管弦乐器,但其音源的频谱具有管弦乐音源的特征,因此这里将其归为一类)等。与之相反,打击乐器产生的音源一般有强烈的节奏感,音与音之间有较大的跨度在频谱图上表现为垂直包络,常见的打击乐器有鼓、木琴、小军鼓、锣等。因此在频谱图上,将管弦乐所产生的音源通常称之为谐波源,打击乐产生的音源通常称之为冲击源。谐波源通常包含固定音调,能在频谱上形成一系列平滑的瞬时包络,因此在时间轴方向上是平滑连续的,在频率轴方向上间断的;反之,冲击源一般集中在较短时间内,在频谱上形成一系列垂直的宽带谱包络,因此在时间轴方向上是间断的,在频率轴方向上是平滑连续的。

在计算音频特征时,会根据这两种信号的不同特点,进行分离后分别进行特征计算。比如chroma特征就只使用了谐波源作为源数据
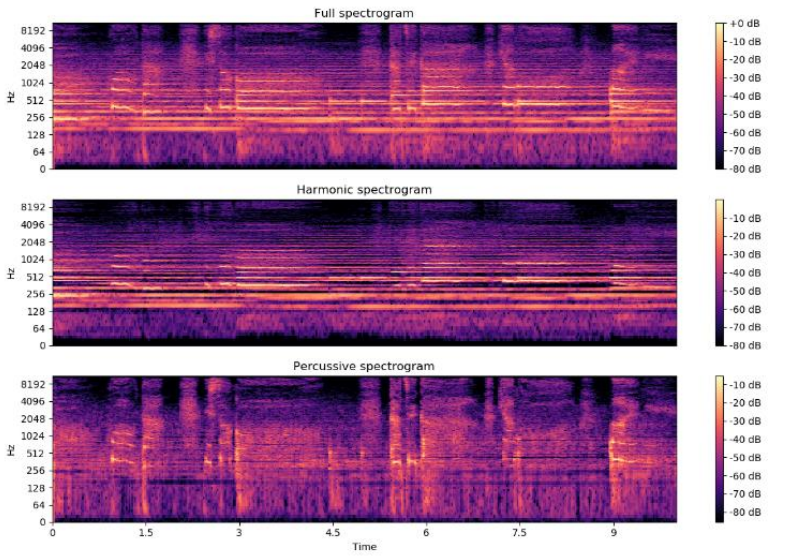
image-20200504154037385

音频特征:

  • MFCC(Mel-frequency cepstral coefficients)

    梅尔频率倒谱系数。梅尔频率是基于人耳听觉特性提出来的, 它与Hz频率成非线性对应关系。

    当频率在1000Hz以下时,人耳的听觉能力与声音频率呈线性增长,当频率在1000Hz以上时,与声音的频率呈对数分布。梅尔频率倒谱系数(MFCC)则是利用它们之间的这种关系,计算得到的Hz频谱特征。主要用于语音数据特征提取和降低运算维度。
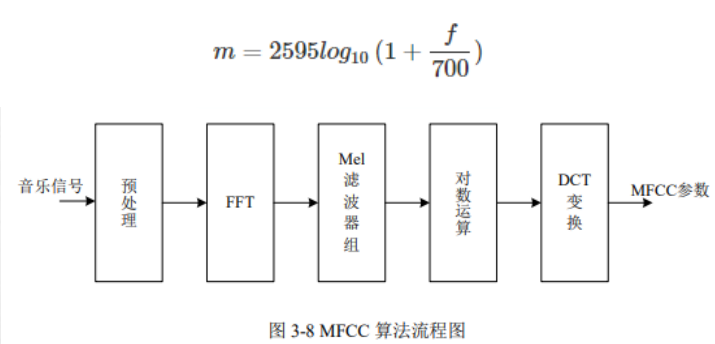
    image-20200504153802954

  • Chroma色度特征是色度向量(Chroma Vector)和色度图谱(Chromagram)的统称。色度向量是一个含有12个元素的向量,这些元素分别代表一段时间(如1帧)内12个音级中的能量,不同八度的同一音级能量累加,色度图谱则是色度向量的序列。色度特征的计算,参考:Automatic Chord Estimation from Audio: A R

    eview of the State of the Art,过程如下图:
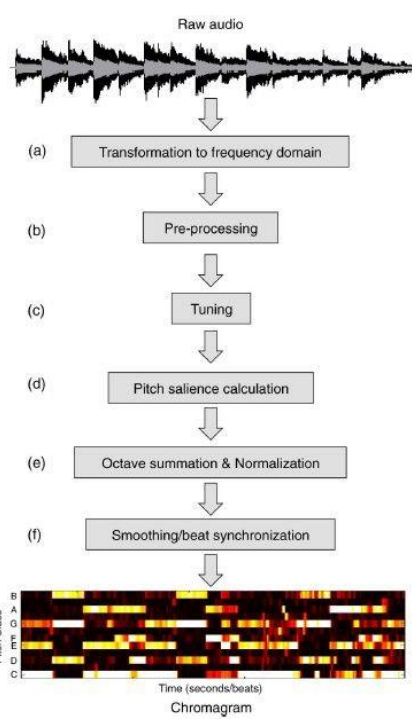
    image-20200504153901633

提取MFCC和Chroma

提取MFCC和Chroma的代码如下:

1
2
3
4
5
6
7
8
9
10
11
12
13
14
15
16
17
18
19
20
21
22
23
24
25
26
27
28
29
30
31
32
33
34
35
36
37
38
39
40
41
42
43
44
45
46
47
48
49
50
51
52
53
54
55
56
57
58
59
60
61
62
63
# -*- coding: UTF-8 -*-
# Feature extraction example
import numpy as np
import librosa
import librosa.display
import matplotlib.pyplot as plt
#加载音频
# Load the example clip
y, sr = librosa.load("1.wav")

# Set the hop length; at 22050 Hz, 512 samples ~= 23ms
hop_length = 512

#时序y被分为信号的谐波和冲击两个时序,都与y有着相同的形状和时间长度。
#划分的意义:首先, percussive能够更好地表示节奏信息,意味着它能提供更稳定地节拍跟踪结果。
#其次, percussive在所有频带上都会贡献能量,会污染声调特征chroma,所以在计算chroma时会把percussive去掉。
# Separate harmonics and percussives into two waveforms
y_harmonic, y_percussive = librosa.effects.hpss(y) #频域内的谐波冲击波分离


#冲击信号计算节拍
# Beat track on the percussive signal
Tempo, beat_frames = librosa.beat.beat_track(y=y_percussive,sr=sr)

#计算MFCC特征
# Compute MFCC features from the raw signa
mfcc = librosa.feature.mfcc(y=y, sr=sr, hop_length=hop_length, n_mfcc=13)

#计算每帧之间MFCC的一阶差分
# And the first-order differences (delta features)
mfcc_delta = librosa.feature.delta(mfcc)

# 叠加并同步MFCC特征
# Stack and synchronize between beat events
# This time, we’ll use the mean value (default) instead of median
beat_mfcc_delta = librosa.util.sync(np.vstack([mfcc, mfcc_delta]),beat_frames)

#用谐波计算色度特征
# Compute chroma features from the harmonic signa
chromagram = librosa.feature.chroma_cqt(y=y_harmonic,sr=sr)

#整合色度特征
# Aggregate chroma features between beat events
# We’ll use the median value of each feature between beat frames
beat_chroma = librosa.util.sync(chromagram,beat_frames,aggregate=np.median)

#叠加所有特征
# Finally, stack all beat-synchronous features togethe
beat_features = np.vstack([beat_chroma, beat_mfcc_delta])
#得到beat_features的维度为(12 + 13 + 13, # beat intervals)

#绘制mfcc特征图
plt.subplot(2, 1, 1)
librosa.display.specshow(mfcc, sr=sr, x_axis='time')
plt.title('mfcc')

#绘制chroma特征图
plt.subplot(2, 1, 2)
librosa.display.specshow(chromagram, sr=sr,y_axis='chroma', x_axis='time', hop_length=hop_length, cmap='coolwarm')
plt.title('chromagram')

plt.tight_layout()
plt.show()

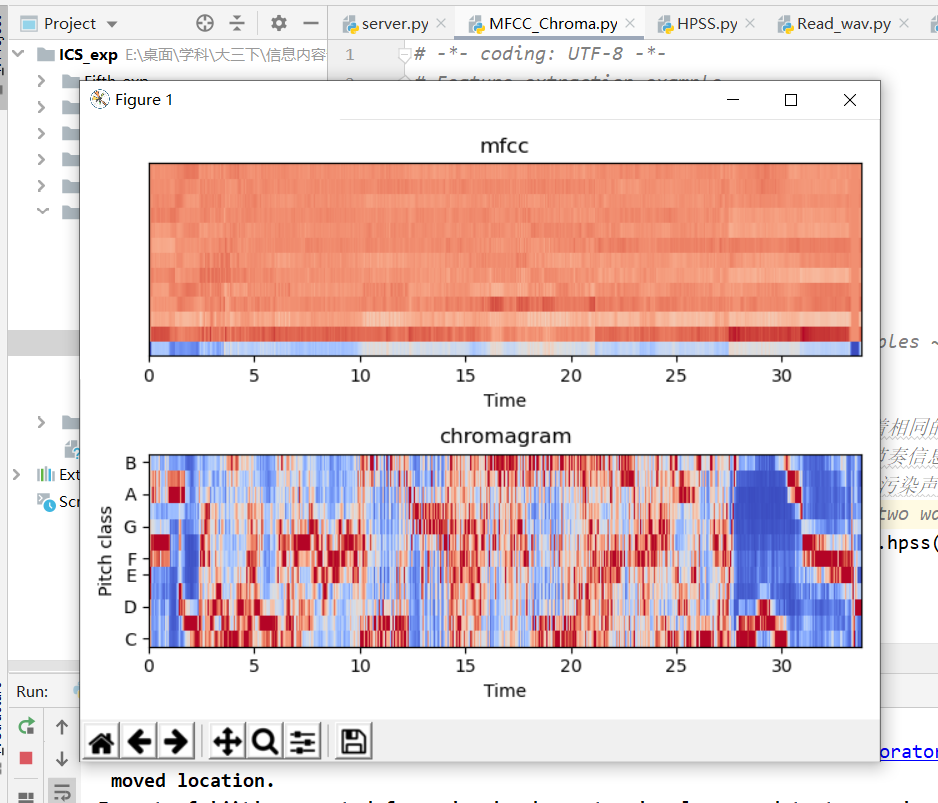
如下为我们的mfcc和chroma的特征图

image-20200504155357411

2.4 提取过零率特征

过零率(zero crossing rate)是一个信号符号变化的比率,即,在每帧中,语音信号从正变为负或从负变为正的次数。 这个特征已在语音识别和音乐信息检索领域得到广泛使用,通常对类似金属、摇滚等高冲击性的声音的具有更高的价值。

该特征在语音识别和音乐信息检索中都被大量使用。对于像金属和岩石那样的高冲击声,它通常具有更高的值。让我们计算示例音频片段的过零率。

1
2
3
4
5
6
7
8
9
10
11
12
13
14
15
16
17
18
19
# -*- coding: UTF-8 -*-
import librosa.display
import matplotlib.pyplot as plt
# 加载信号
x, sr = librosa.load("1.wav")
#绘制信号波形图
# plt.figure(figsize=(14, 5))
# librosa.display.waveplot(x, sr=sr)
# 放大n0~n1区间,绘制过零点
n0 = 9000
n1 = 9100
plt.figure(figsize=(14, 5))
plt.plot(x[n0:n1])
plt.grid()
plt.tight_layout()
plt.show()
#计算在n0~n1区间的过零率数目
zero_crossings = librosa.zero_crossings(x[n0:n1], pad=False)
print(sum(zero_crossings))

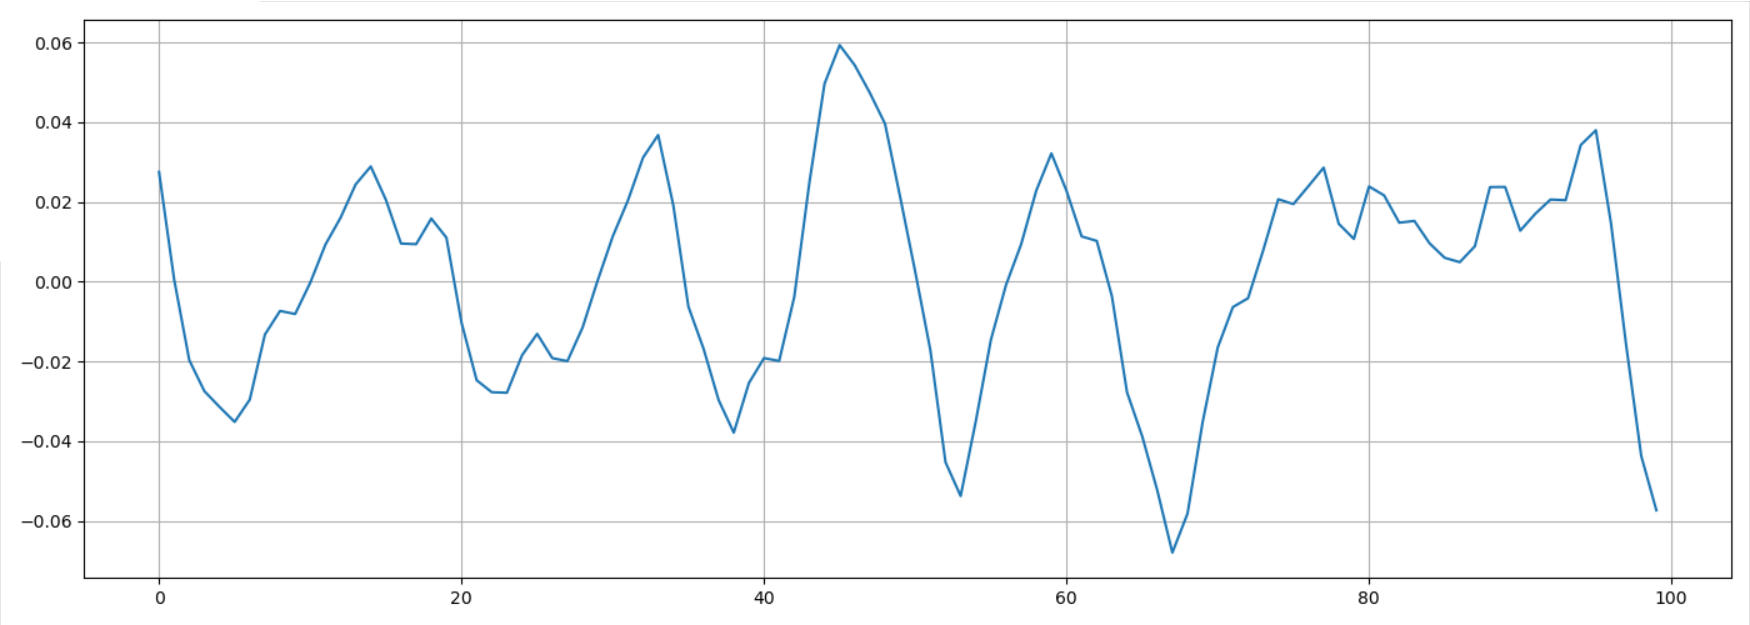
在这段区间(9000~9100)有11个过零点

image-20200504160541818

image-20200504160027498

2.5 提取光谱质心特征

光谱质心(Spectral Centroid)指示声音的“质心”位于何处,并按照声音的频率的加权平均值来加以计算。 假设现有两首歌曲,一首是蓝调歌曲,另一首是金属歌曲。现在,与同等长度的蓝调歌曲相比,金属歌曲在接近尾声位置的频率更高。所以蓝调歌曲的频谱质心会在频谱偏中间的位置,而金属歌曲的频谱质心则靠近频谱末端。

librosa.feature.spectral_centroid 计算信号中每帧的光谱质心:
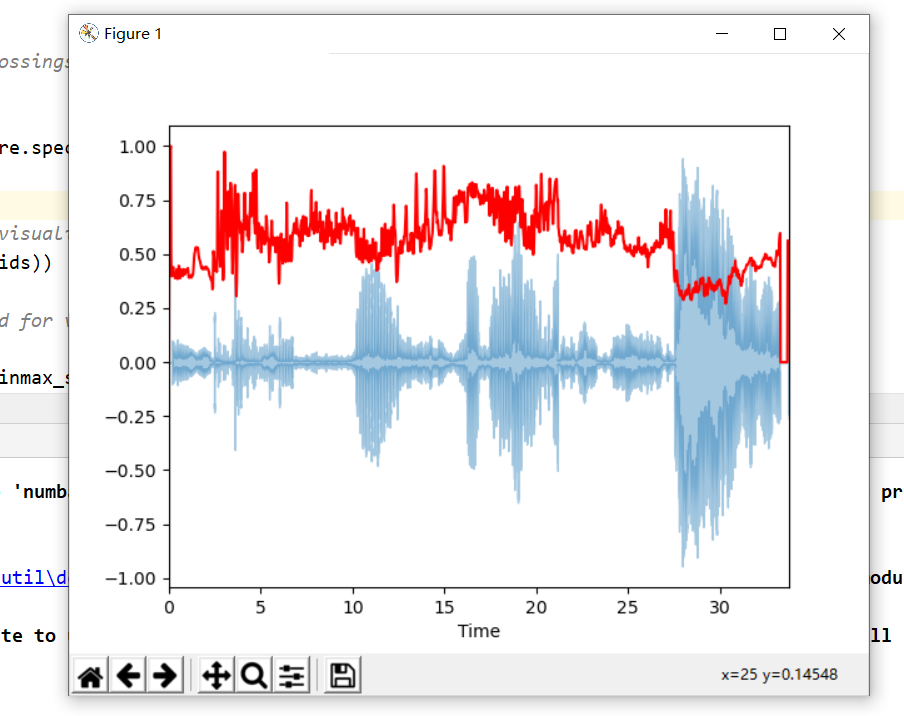
image-20200504160815181

1
2
3
4
5
6
7
8
9
10
11
12
13
14
15
16
17
18
19
20
21
22
23
24
# -*- coding: UTF-8 -*-
import librosa.display
import matplotlib.pyplot as plt
# 加载信号
import sklearn

x, sr = librosa.load("1.wav")

spectral_centroids = librosa.feature.spectral_centroid(x, sr=sr)[0]
print(spectral_centroids.shape)
# (2647,)
#计算可视化时间变量
# Computing the time variable for visualization
frames = range(len(spectral_centroids))
t = librosa.frames_to_time(frames)
#标准化光谱质心以进行可视化
# Normalising the spectral centroid for visualisation
def normalize(x, axis=0):
return sklearn.preprocessing.minmax_scale(x, axis=axis)
#可视化光谱质心
#Plotting the Spectral Centroid along the waveform
librosa.display.waveplot(x, sr=sr, alpha=0.4)
plt.plot(t, normalize(spectral_centroids), color='r')
plt.show()

参考资料:

LIBROSA处理音频信号 https://www.freesion.com/article/4795221829/

3、总结

  • 这次实验挺有趣的,难度也适中。
  • 大多数时候出错,都是api不熟悉导致的,多看多敲就好了。
  • 图像处理部分的透视变化、numpy的熟悉、HOG特征的计算、KNN、SVM聚类的学习。音频部分对音频特征和参数的介绍等等,学到了很多东西。
  • 但是,信息数据处理才是刚刚入了一点点门,还得继续努力才是。